


Quick answer
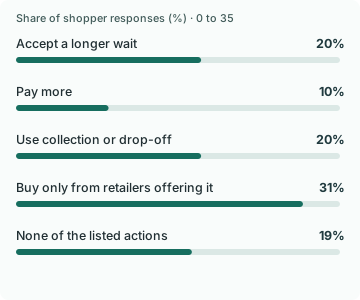
In DHL’s 2026 global shopper survey, 20% said they would accept longer delivery or return times for sustainability and 10% said they would pay more. Another 20% chose use of a collection or drop-off point in the same question. A separate question found 46% had chosen eco-friendly delivery or returns. The responses describe different decisions and cannot predict how many buyers will choose a specific option.
Key findings and sources
Twice as many respondents selected a longer wait as a higher price
In DHL’s 2026 survey question on more sustainable delivery and returns, 20% selected accepting longer times and 10% selected paying more. That is a ten-point difference and a two-to-one ratio of the rounded responses.
DHL, 2026 E-Commerce Trends Report
Pickup and additional time tied in the published responses
Using a collection or drop-off point and accepting longer delivery or return times each drew 20% in the same DHL 2026 question. Those are separate reported choices, with no evidence that the same customers selected both.
DHL, 2026 E-Commerce Trends Report
Prior use and future interest were separately reported
In a separate 2026 DHL shopper question, 46% reported choosing eco-friendly delivery or returns, 20% were looking to do so, and 34% answered no. The wording combines delivery and returns and does not identify a fee.
DHL, 2026 E-Commerce Trends Report
Business supply and future plans came from a separate sample
In the DHL 2026 business survey, 53% reported offering eco-friendly delivery or returns and 21% were looking to offer them. Those responses are independent of the survey that asked shoppers about their own choices.
DHL, 2026 E-Commerce Trends Report
Ten of 29 markets favored collection over a longer wait on the most-likely action question
In DHL’s 2026 sustainable delivery and returns table, collection or drop-off had a higher displayed response than accepting longer timing in 10 of 29 country rows. Two rows tied. Paying more led accepting longer timing in only China and Nigeria.
DHL, 2026 E-Commerce Trends Report
DHL’s 29 published country rows, December 2025 to February 2026; one most-likely action question. Compare the displayed percentages within each row, excluding the global aggregate.
The pickup-versus-wait gap differed by 38 points between France and the US
DHL’s 2026 country table shows 46% collection and 12% longer timing in France, versus 15% and 19% in the US. The pickup-minus-wait gap was 34 points in France and negative four in the US.
DHL, 2026 E-Commerce Trends Report
DHL’s 2026 France and US shopper samples, stated most-likely action. Subtract longer-timing response from collection response in each country; compare signed gaps.
Compare the results
A customer may accept more time before they accept a higher price
The reported willingness to wait was twice the reported willingness to pay more in the same DHL question, 20% versus 10%. Collection or drop-off also drew 20%. Those options put the work in different places. A slower shipment trades elapsed time for another benefit, while pickup asks the buyer to travel to a location. Make the date and pickup details easy to see beside the price. The percentages do not make these changes equivalent for a particular buyer.
The 31% who said they would only buy from retailers with sustainable delivery or returns point to a different proposition. A store should not translate that response into a forecast that the same group would pay for an upgrade. The choice at checkout is narrower: what is available for this item, at what price, by when, and with what change to the fulfillment method.
Separate past choices from interest in the next checkout
In a different question, 46% said they had chosen eco-friendly delivery or returns. Another 20% were looking to do so and 34% answered no. That 46% concerns a combined delivery-or-returns answer, and it does not specify the fee or wait that any respondent faced. Separately, 53% of businesses said they already offered an eco-friendly delivery or returns option, and 21% were looking to offer one. You cannot subtract those survey groups to estimate unmet demand.
The answer needs to be narrower than a green label. Describe the change the buyer can verify, such as consolidated dispatch or a named collection point, and make clear what you can promise about the estimated date. If the benefit depends on a route or parcel type, verify that the promise applies to the selected cart before presenting it. An option that cannot be fulfilled for the current order creates the same trust problem as any other unsupported shipping claim.
Test the trade-off without hiding the standard option
Start with the group that can genuinely use both services. Hold the regular option and its promised timing steady while testing whether buyers choose a slower or collection alternative. Show a separate price and date for each and avoid assuming that a free option is a test of willingness to pay. A paid comparison needs its own design, because shoppers could be responding to the fee rather than to the alternative itself.
Track which option is selected, whether the order is completed, whether you meet the stated date, and what happens to variable contribution after delivery costs and exceptions. Retain a record of invalid addresses and unavailable services so those orders do not quietly disappear from the denominator. The practical question is whether a reliable additional option serves a buyer who would otherwise be poorly served, even when its share of all orders is modest.
The global tie between pickup and waiting conceals different local choices
DHL’s global row puts collection or drop-off and accepting a longer time at 20% each. Across the 29 published country rows, ten placed collection or drop-off ahead of accepting a longer time, two tied at the displayed precision, and seventeen placed the longer time ahead. Higher price led the longer-time option in just China and Nigeria. The question asked what respondents would be most likely to do, so these differences are choices among the displayed alternatives and do not estimate willingness under every possible checkout offer.
France supplies the clearest reason to examine country rows before designing a global default. Forty-six percent selected collection or drop-off and 12% selected a longer time. The US row shows 15% and 19% respectively. The signed pickup-minus-wait gap moves from plus 34 points in France to minus four in the US. Market comparisons need sample and availability context. A denser pickup network or a different interpretation of the options could explain some of the contrast.
Test a greener option with a promise the merchant can keep
For an actual checkout, offer a verifiable choice that specifies price, delivery window and pickup location. Keep the options comparable when testing uptake. If a route costs the same and arrives a day later, show that delay explicitly. If a pickup point has a short collection window or unusual access requirement, surface the requirement before the buyer selects it. Record whether eligible customers complete checkout and successfully collect, rather than using an option click as adoption.
Treat estimated environmental effects as a separate measurement. A carrier’s label or consolidated route is insufficient on its own to infer a reduction for a given order. If travel to a collection point is material, the result depends on assumptions about the customer’s trip. Prioritize a test where a workable route exists, the price and timing can be honored, and your checkout can preserve the buyer’s explicit choice through fulfillment. In a market where the merchant lacks a reliable collection network, improve the clarity of existing options before adding a sustainability label.
Study data
| Measure | Value | Context |
|---|---|---|
| Would only buy from retailers with sustainable delivery or returns | 31% | Would only buy from retailers with sustainable delivery or returns |
| Would accept longer delivery or return times | 20% | Would accept longer delivery or return times |
| Would use collection or drop-off points | 20% | Would use collection or drop-off points |
| Would do none of the listed actions | 19% | Would do none of the listed actions |
| Would pay more for delivery or returns | 10% | Would pay more for delivery or returns |
| Had chosen eco-friendly delivery or returns | 46% | Had chosen eco-friendly delivery or returns |
| Looking to choose eco-friendly delivery or returns in future | 20% | Looking to choose eco-friendly delivery or returns in future |
| Answered no to choosing eco-friendly delivery or returns | 34% | Answered no to choosing eco-friendly delivery or returns |
| Had received repair or maintenance information | 50% | Had received repair or maintenance information |
| Had bought spare parts for repair | 48% | Had bought spare parts for repair |
| Had used trade-in or buy-back schemes | 37% | Had used trade-in or buy-back schemes |
| Businesses already offering eco-friendly delivery or returns | 53% | Businesses already offering eco-friendly delivery or returns |
| Businesses looking to offer eco-friendly delivery or returns in future | 21% | Businesses looking to offer eco-friendly delivery or returns in future |
| Businesses answering no to offering eco-friendly delivery or returns | 26% | Businesses answering no to offering eco-friendly delivery or returns |
| Would prefer out-of-home pickup points for sustainability reasons | 23% | Would prefer out-of-home pickup points for sustainability reasons |
| French respondents choosing collection or drop-off | 46% | Published source value |
| French respondents choosing longer delivery or return time | 12% | Published source value |
| US respondents choosing collection or drop-off | 15% | Published source value |
| US respondents choosing longer delivery or return time | 19% | Published source value |
What changes when you compare the figures
| Comparison | Result | Calculation |
|---|---|---|
| Stated willingness to wait versus willingness to pay | 10 percentage points | = 20 - 10 |
| Ratio of stated willingness to wait to willingness to pay | 2.0 times | = 20 / 10 |
| Share selecting a sustainable-only retailer versus paying more | 21 percentage points | = 31 - 10 |
| Had chosen eco-friendly delivery or returns minus looking to do so | 26 percentage points | = 46 - 20 |
| Business yes versus looking to offer eco-friendly delivery or returns | 32 percentage points | = 53 - 21 |
| Share of country rows choosing pickup more often than longer timing | 34.4828 % of country rows | = 10 / 29 * 100 |
| Share of country rows choosing higher price more often than longer timing | 6.8966 % of country rows | = 2 / 29 * 100 |
| France to US gap in collection or drop-off response | 31 percentage points | = 46 - 15 |
| France to US change in the pickup-minus-wait response gap | 38 percentage points | = (46 - 12) - (15 - 19) |
Methodology and sources
We transcribed the five trade-off responses and the relevant experience and offering rows from DHL’s 2026 report. Subtract or divide the published rounded percentages to reproduce the comparisons. The shopper and business surveys ran in parallel and are independent. The study does not supply order choices or certify the environmental performance of any shipping option.
Download the source data (CSV)
Download the calculations (CSV)
Related reading
Delivery option statistics and checkout abandonment
Cross-border checkout statistics for duties, delivery and buyer trust
Free shipping checkout statistics and how to test a minimum spend
Sources and definitions
DHL, 2026 E-Commerce Trends Report
The source data includes the population, period, denominator and limitations for every figure.