


Quick answer
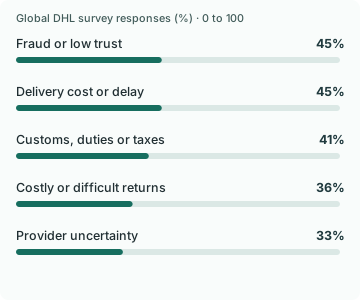
In DHL’s 2026 cross-border survey, 45% of global shoppers cited delivery cost or delay as a barrier, 45% cited fraud or lack of trust, and 41% cited customs, duties or taxes. The European row reverses the delivery and duties ordering: 39% cited delivery cost or delay and 42% cited duties or taxes. Use the destination and payable total to check which obstacle the buyer actually faces.
Key findings and sources
Delivery and trust tie globally
In DHL’s 2026 survey across 29 countries, 45% in the global cross-border barrier row cited delivery cost or delay, 45% cited fraud or lack of trust, and 41% cited customs, duties or taxes. Responses could overlap.
DHL, 2026 E-Commerce Trends Report
Europe reverses the delivery and duties ordering
The European row of DHL’s 2026 cross-border survey reports 42% for customs, duties or taxes and 39% for delivery cost or delay as stated barriers. Globally those values were 41% and 45%, respectively. The comparison uses rounded multiple-choice survey responses.
DHL, 2026 E-Commerce Trends Report
Customs concerns vary across the displayed generations
In DHL’s 2026 cross-border survey tables, 36% of Gen Z, 38% of Millennials, 43% of Gen X and 47% of Baby Boomers cited customs, duties or taxes as barriers. The subgroup counts are not reported alongside these rounded responses.
DHL, 2026 E-Commerce Trends Report
Payment protection and price display are separate stated incentives
In DHL’s 2026 global cross-border encouragement question, 48% selected secure payment or buyer protection, 41% selected local currency and 37% selected clear transit times. These responses describe stated encouragement.
DHL, 2026 E-Commerce Trends Report
Lower prices lead the stated reasons for buying abroad
In the global row for why shoppers buy from countries abroad, DHL’s 2026 survey lists lower prices at 60% and product or brand unavailability at home at 44%. Respondents could give multiple reasons.
DHL, 2026 E-Commerce Trends Report
The largest of three European versus global gaps was delivery cost or delay
In DHL’s 2026 cross-border barrier table, global minus European responses were six points for delivery cost or delay, four for provider uncertainty and three for fraud or lack of trust. The European customs figure was one point above the global result. These are descriptive comparisons of survey aggregates.
DHL, 2026 E-Commerce Trends Report
Cross-border shoppers distinguished readable prices from arrival information
DHL’s global 2026 cross-border survey reported encouragement from buyer protection or secure payment at 48%, local-currency pricing at 41%, and clear transit times at 37%. The local-currency-versus-transit gap was four points, comparing reported incentives rather than observed checkout behavior.
DHL, 2026 E-Commerce Trends Report
The gap across age groups was larger for return barriers than delivery barriers
In DHL’s 2026 cross-border survey, 44% of Baby Boomers and 31% of Gen Z respondents selected complicated or costly returns as a barrier. The same groups gave 48% and 44% for high delivery cost or long delivery time. The two age-group gaps differ by nine points.
DHL, 2026 E-Commerce Trends Report
Global DHL cross-border survey, published Gen Z and Baby Boomer rows for December 2025 to February 2026. Calculate the Baby Boomer minus Gen Z difference for each barrier and subtract the two gaps.
Local-currency incentives had a twelve-point age gap while transit clarity had one
DHL’s 2026 cross-border table reports 49% versus 37% for local-currency pricing and 37% versus 36% for clear transit times, comparing Baby Boomers with Gen Z. The comparison concerns selected incentives.
DHL, 2026 E-Commerce Trends Report
DHL’s 2026 global cross-border shopper age groups, reported incentive items. Compare the same two age-group rows within each incentive column.
Compare the results
Price attracts the shopper before the landed total tests the order
Lower prices drew 60% of global shoppers in DHL’s displayed reasons for buying abroad. Forty-four percent cited a product or brand unavailable at home. These motives can coexist, and they lead to different checkout conversations. Someone searching for an exclusive item may want certainty about when it will arrive. A price-sensitive customer may want the total before comparing your offer with a local seller.
Build the pricing check around the payable amount for the exact destination. A price advertised in the buyer’s currency can still leave freight, tax or possible collection charges unclear. Use one real test basket, the destination and the same SKU mix you see in the recovery conversation. Compare the product view, cart, checkout and the payment screen. Write down which charges are included and which the buyer may still face. The explanation should match what checkout can substantiate for that order.
The global ranking can send you to the wrong fix
Globally, 45% selected delivery cost or delay and 41% selected customs, duties or taxes as barriers. For European respondents the published values are 39% and 42%, respectively. The ordering flips by seven points when you compare the two within-row gaps. A team using only the global order might open the carrier contract first even though its current destination route has a missing landed-cost explanation.
The delivery question combines price and speed. You cannot tell from the 45% whether a shopper wanted cheaper freight, a faster arrival or both. Record the two issues separately when you review customer conversations. If the buyer mentions price, show the actual delivery cost and payable total. If the buyer asks for a deadline, check the displayed dates and exceptions for that destination. When the buyer mentions both, resolve the pair with the same route and basket rather than presenting unrelated promises.
Trust includes what happens after delivery
Complicated or costly returns were selected by 36% globally and 35% in the European row. Uncertainty about providers was selected by 33% and 29%, respectively. Fraud or lack of trust was also selected by 45% globally, tied with delivery cost or delay. These are distinct answers to the same barrier question. They cannot be summed into the share of customers facing a trust problem.
If a shopper asks about returns, provide the exact return route for the destination. Explain whether a label is provided, who pays return shipping and what the store can confirm about the original charges. If a shopper asks whether payment is safe, keep the checkout link on the verified store and explain only the buyer protections that apply. A message that promises an easy return when the checkout cannot explain the route risks moving confusion from checkout to support.
Turn the survey into a destination-level checkout test
Among the global answers to a different question, 48% said secure payment or buyer protection would encourage buying abroad, 41% selected local-currency prices, and 37% selected clear transit times. Those figures help you plan a review. They do not tell you how much conversion rises after changing a payment badge, exchange rate display or delivery estimate.
Choose one cross-border route with enough orders to observe. Keep the destination, product mix and channel visible. Measure both paid orders and post-purchase outcomes such as delivery disputes and return contacts. If you test a landed-price explanation, keep the carrier and shipping offer stable. If the carrier offering is the change, document the payment and returns rules so support can identify what the shopper was actually shown. Check your own customer base before making choices based on the generation rows.
For example, if shoppers open the order from a recovery link and the currency stays correct while the postal destination resets, an apparently good price can hide a broken quote. Verify the saved and fresh checkout states for the same destination. Compare the charge breakdown and delivery promise in both sessions before attributing the problem to price sensitivity.
The regional comparison points to three different checks
In DHL’s 2026 cross-border barrier table, the European figure for high delivery cost or a long wait was 39%, six points below the 45% global figure. The fraud or trust barrier was three points lower and provider uncertainty four points lower. Customs, duties or taxes went the other way: 42% in Europe versus 41% globally. Europe contributes to the global sample, and the two aggregates should not be treated as independent groups. The differences help compare where the reported priorities sit, not predict a market response.
These figures call for three separate audits. A shipping-cost issue means checking the rate and lead time visible for the destination. A customs issue means checking whether the landed cost and the party collecting it are explained. A provider uncertainty issue means showing the actual shipping or return route. One message about “international shipping” cannot diagnose all three.
For a localized release, choose a representative cart and delivery location, then trace the quote from product page to payment. Record the amount and timing displayed before and after address entry. If buyer questions concentrate on an unexpected charge, investigate that line item rather than assuming it is the shipping rate. Keep the survey as a prioritization cue and use actual checkout evidence to test the remedy.
A local-currency total and a clear arrival date are separate promises
DHL’s global cross-border survey reported that 48% were encouraged by secure payment or buyer protection, 41% by prices shown in local currency and 37% by clear transit times. The local-currency versus transit-time gap was four percentage points, and buyer protection was seven points above local-currency pricing. Those are comparisons between reported incentives, and one shopper can care about all three.
Currency display can help the buyer read the price without knowing what will be charged at the door. If a quote includes the expected duties or taxes, state the basis for the quote and whether additional charges may apply. If it only converts the merchandise price, keep the shipping and duties uncertainty visible. Separately, say whether the arrival date is an estimate and when the store can update it. An answer about payment protection does not establish any of these amounts or dates.
Put the figures to work as a checkout audit. Open a cart that can ship to your most common overseas destination and verify that the same total appears in the conversation and the actual checkout. Repeat on a destination for which the duties cannot be estimated. A clear path to a complete answer is preferable to a confident number based on an incomplete quote. Track whether unanswered questions concern the price, the shipping date, or the protection available if the transaction goes wrong.
A cross-border checkout has different problems before and after the parcel leaves
DHL reports that complicated or costly returns were a barrier for 31% of Gen Z respondents and 44% of Baby Boomers. The 13-point gap is more than three times the four-point difference on high delivery cost or long delivery time, which 44% and 48% selected respectively. A message that only improves the delivery estimate leaves the return decision unresolved. These are age-group summaries from the published survey and can reflect geography, category mix, or shopping habits as well as age.
The incentives table separates the price display and the arrival estimate in a similar way. Prices in local currency were selected by 37% of Gen Z respondents and 49% of Baby Boomers. Clear transit times drew 36% and 37%, a one-point gap. The two age-group gaps differ by 11 points. This is an argument for giving the price and the transit estimate separate places in the checkout audit, rather than assuming one disclosure covers the other.
Use the destination to make the right terms visible
Prepare a cart for each cross-border destination the business serves and carry it from the product page through the review step. Record the currency, the delivery interval, and when any duty or tax becomes known. Check who collects charges that are paid on arrival, where the parcel would go if returned, and what the customer pays in that case. Give buyers a clear place to ask before payment when the answer depends on a choice they have yet to make.
Test whether the clearer information helps all eligible shoppers in the destination, and track delivery-related and return-related questions separately. The survey can help choose which terms to inspect first. Age margins do not justify targeting an individual shopper by age. If a supplier or carrier cannot provide a stable duty estimate before the destination is known, explain that dependency and measure how often the final checkout total changes after the quote. Avoid calling a quote final until you can account for all amounts the merchant controls.
Study data
| Measure | Value | Context |
|---|---|---|
| Global: Fraud or lack of trust | 45% | 45% selected this response |
| Global: High delivery cost or long wait | 45% | 45% selected this response |
| Global: Customs, duties or taxes | 41% | 41% selected this response |
| Global: Complicated or costly returns | 36% | 36% selected this response |
| Global: Uncertainty about delivery or returns providers | 33% | 33% selected this response |
| Europe: Fraud or lack of trust | 42% | 42% selected this response |
| Europe: High delivery cost or long wait | 39% | 39% selected this response |
| Europe: Customs, duties or taxes | 42% | 42% selected this response |
| Europe: Complicated or costly returns | 35% | 35% selected this response |
| Europe: Uncertainty about delivery or returns providers | 29% | 29% selected this response |
| Gen Z: Customs, duties or taxes | 36% | 36% selected this response |
| Millennials: Customs, duties or taxes | 38% | 38% selected this response |
| Gen X: Customs, duties or taxes | 43% | 43% selected this response |
| Baby Boomers: Customs, duties or taxes | 47% | 47% selected this response |
| Global: Secure payment or buyer protection | 48% | 48% selected this response |
| Global: Prices shown in local currency | 41% | 41% selected this response |
| Global: Clear transit times | 37% | 37% selected this response |
| Global: Lower prices | 60% | 60% selected this response |
| Global: Product or brand unavailable at home | 44% | 44% selected this response |
| Measure | Value | Context |
|---|---|---|
| Complicated or costly returns, Gen Z | 31% | Published source value |
| Complicated or costly returns, Baby Boomers | 44% | Published source value |
| High delivery costs or long wait, Gen Z | 44% | Published source value |
| High delivery costs or long wait, Baby Boomers | 48% | Published source value |
| Local-currency prices, Gen Z | 37% | Published source value |
| Local-currency prices, Baby Boomers | 49% | Published source value |
| Clear transit times, Gen Z | 36% | Published source value |
| Clear transit times, Baby Boomers | 37% | Published source value |
What changes when you compare the figures
| Comparison | Result | Calculation |
|---|---|---|
| Global delivery barrier minus global duties barrier | 4 percentage points | = 45 - 41 |
| European duties barrier minus European delivery barrier | 3 percentage points | = 42 - 39 |
| Shift in delivery-versus-duties gap from global to Europe | 7 percentage points | = (45 - 41) - (39 - 42) |
| Baby Boomer minus Gen Z customs barrier | 11 percentage points | = 47 - 36 |
| Global buyer protection encouragement minus clear transit times | 11 percentage points | = 48 - 37 |
| Global minus European reported fraud or trust barrier | 3 percentage points | = 45 - 42 |
| Global minus European reported delivery cost or delay barrier | 6 percentage points | = 45 - 39 |
| Global minus European reported provider uncertainty | 4 percentage points | = 33 - 29 |
| Global minus European reported customs barrier | -1 percentage points | = 41 - 42 |
| Local-currency incentive minus clear-transit-times incentive | 4 percentage points | = 41 - 37 |
| Buyer-protection incentive minus local-currency incentive | 7 percentage points | = 48 - 41 |
| Baby Boomer minus Gen Z reported return barrier | 13 percentage points | = 44 - 31 |
| Baby Boomer minus Gen Z reported combined delivery barrier | 4 percentage points | = 48 - 44 |
| Difference in age-group gaps between return and delivery barriers | 9 percentage points | = (44 - 31) - (48 - 44) |
| Difference in age-group gaps between local currency and transit-time incentives | 11 percentage points | = (49 - 37) - (37 - 36) |
Methodology and sources
Transcribed the global, Europe and selected generation rows in the three DHL cross-border question tables. The overall 2026 shopper survey covered 29,000 respondents across 29 countries, 1,000 per country, fielded December 15, 2025 through February 11, 2026. DHL does not report the exact subgroup count beside these rows. Question answers can overlap. Differences use published rounded percentages within the stated question. The overall, regional and generational rows answer questions about stated barriers and motivators. None estimates what one site would recover after a change.
Download the source data (CSV)
Download the calculations (CSV)
Related reading
Delivery option statistics and checkout abandonment
Free shipping checkout statistics and how to test a minimum spend
Sustainable delivery checkout statistics and the price trade-off
Sources and definitions
DHL 2026 Cross-Border Buying Behavior Trends
The source data includes the population, period, denominator and limitations for every figure.